
")
Trading edge in prediction and derivatives markets has always come from the math underneath: Distributions, probability cones, and the statistical shape of where prices are likely to go. The bottleneck has rarely been the math itself, but how long it takes a trader to run the analysis, build the chart, and pull the relevant statistic before the moment passes.

SN50’s Synth LLM is the response to that bottleneck. Launched across Polymarket, Limitless, Hyperliquid, Deribit, and more, it is the first LLM-native interface that converts live Monte Carlo forecasts into custom statistics, charts, and example trades on demand.
In place of a research workflow that takes hours, the entire pipeline collapses into a conversation.
Before we dive deeper, let’s review what Monte Carlo forecasts are…
Monte Carlo forecasts
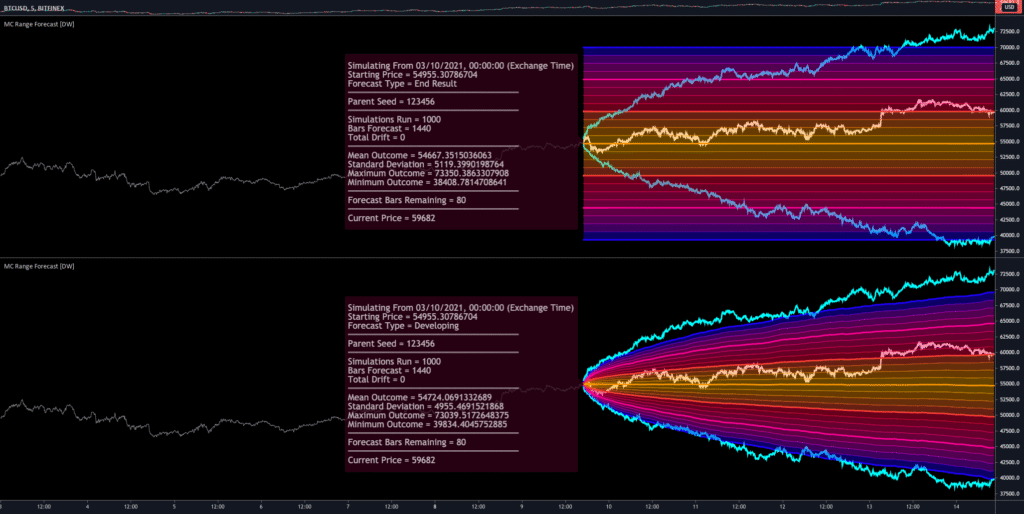
Monte Carlo forecasts are predictions built by running thousands or millions of simulated outcomes instead of trying to predict one exact future. The method starts with a set of assumptions, such as price volatility, probability ranges, historical behavior, or market conditions, then repeatedly “rolls the dice” to see many possible paths an asset, event, or system could take.
In trading, a Monte Carlo forecast might show the likely range where Bitcoin, TAO, or a prediction market price could move over time. Instead of saying “price will be $500,” it gives a probability map: for example, there is a 70% chance price stays between X and Y, a 20% chance it breaks higher, and a 10% chance it falls below a certain level. This makes it useful for risk management, scenario planning, and understanding uncertainty before making a trade.
How to Use Synth LLM
The flow is intentionally short. Most of the friction is upfront, in knowing what to ask. Synth handles the rest.
1. Confirm Access
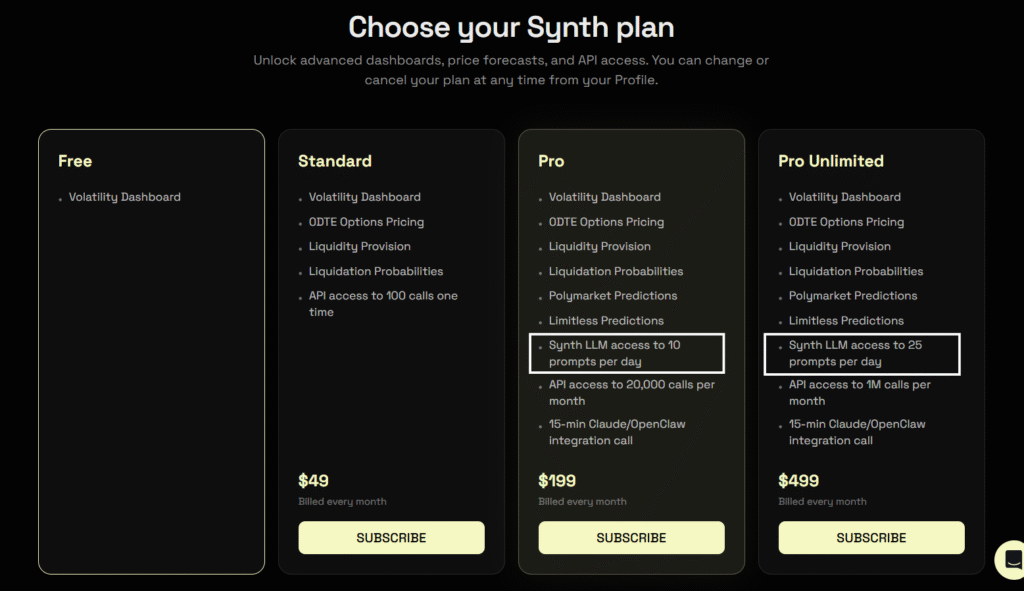
Synth LLM is live for Synth Pro and Pro Unlimited users. If you are not on one of those tiers yet, that is the gating step.
2. Ask the Question in Plain Language
The interface is conversational, so the prompt is just whatever you would normally ask a research analyst. A few examples:
a. “What’s the probability of $BTC closing above $120K by Friday?”
b. “Show me the implied distribution on this Polymarket question.”
c. “What would a delta-neutral straddle around the current $ETH price look like?”
d. “Calculate the expected payoff on this market over the next seven days.”
Synth runs live Monte Carlo paths in the background and structures the response from there.
4. Interpret the Output
Synth’s response is rendered inline as a combination of:
a. A custom forecasting chart built directly from the Monte Carlo paths.
b. Any statistical property you asked for, including mean, variance, tail probabilities, percentiles, and payoff curves.
c. Example trade structures consistent with the analysis.
The chart, the math, and the trade idea sit alongside one another rather than across three separate tabs.
5. Iterate
Adjust the prompt, refine the timeframe, change the asset, or ask for a different statistical view. Each follow-up runs against the same underlying simulation engine.
Conclusion
Synth LLM compresses what used to be hours of model building, charting, and statistical scripting into a single conversation. For traders working across Polymarket, Limitless, Hyperliquid, and Deribit, the practical effect is that Monte Carlo analysis becomes available in the same amount of time it takes to type a question.
The wager underneath the product is that the next generation of trading edge will not come from who has the model. It will come from who can access the model fastest in the moment that matters. Synth is betting it can be that interface.
Enjoyed this article? Join our newsletter
Get the latest TAO & Bittensor news straight to your inbox.
We respect your privacy. Unsubscribe anytime.


Be the first to comment