Most people open a tokenomics dashboard, see a wall of numbers, and quietly close the tab, telling themselves they will come back later when they have more time, more patience, or more context. They rarely do. The problem is not the data itself, but the lack of a clear mental model for what matters and what can be safely ignored.
This guide is designed to fix that. Instead of treating Taostats as a dense analytics terminal, you should think of it as a structured interface about how value is created, distributed, and recycled across the $TAO economy and its subnets.
Once you understand how to read each section, the page stops looking like a spreadsheet and starts behaving like a valuable tool.
Start at the Top: Understanding the $TAO Foundation
Before diving into any subnet, you need to anchor yourself in the base layer, which is the global tokenomics of $TAO itself. Every subnet exists downstream of this system, and its behavior only makes sense in relation to it.
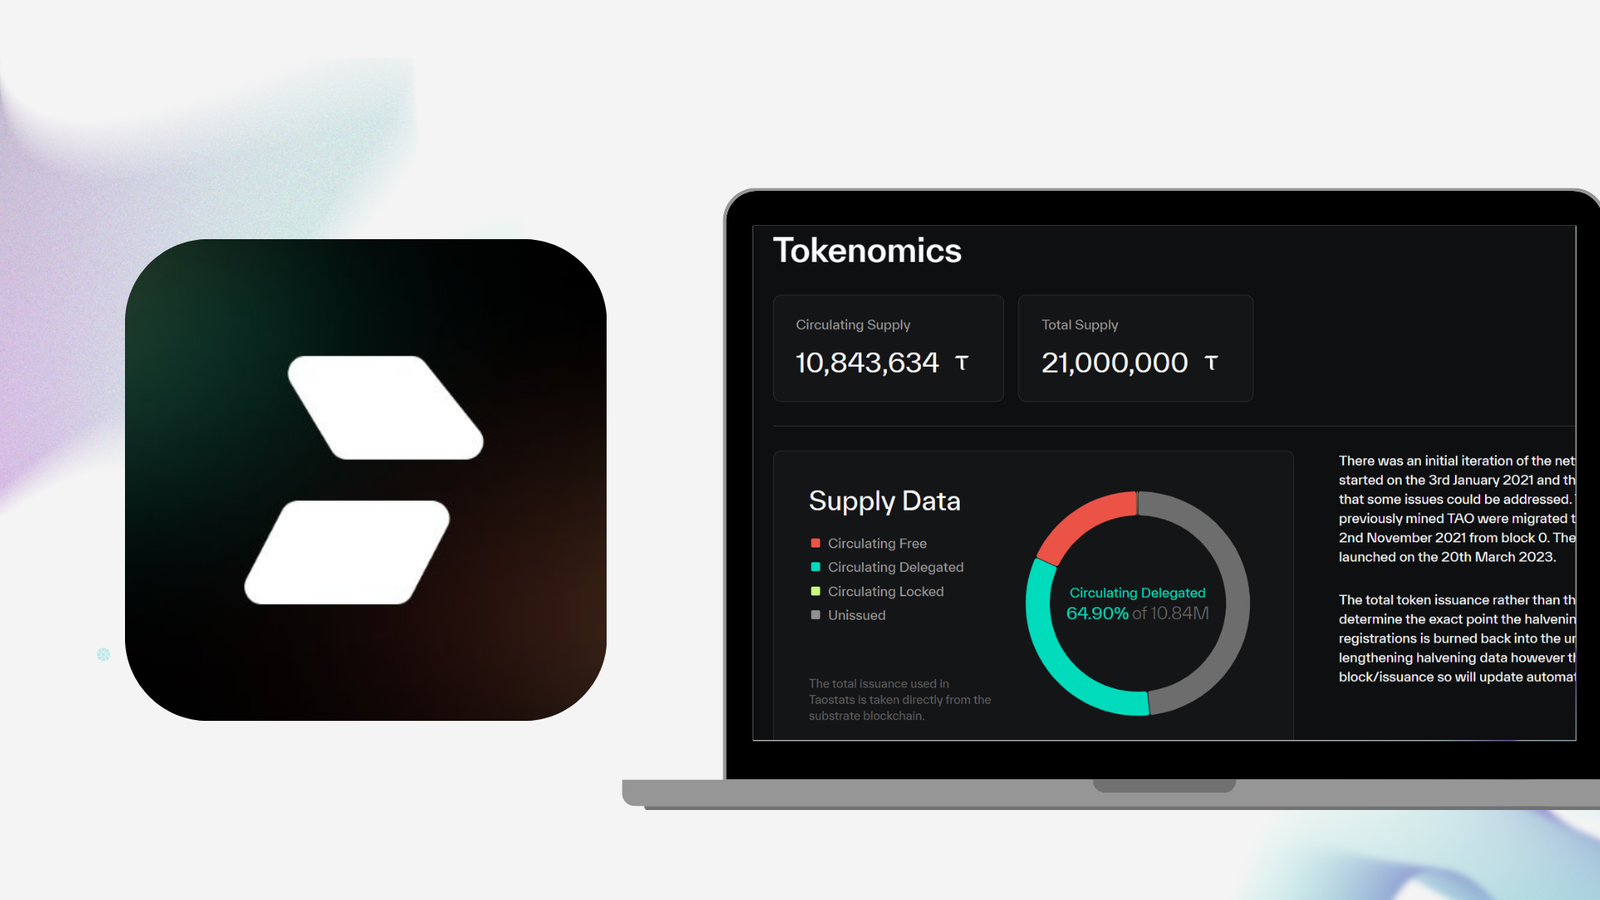
The tokenomics page gives you three essential perspectives:
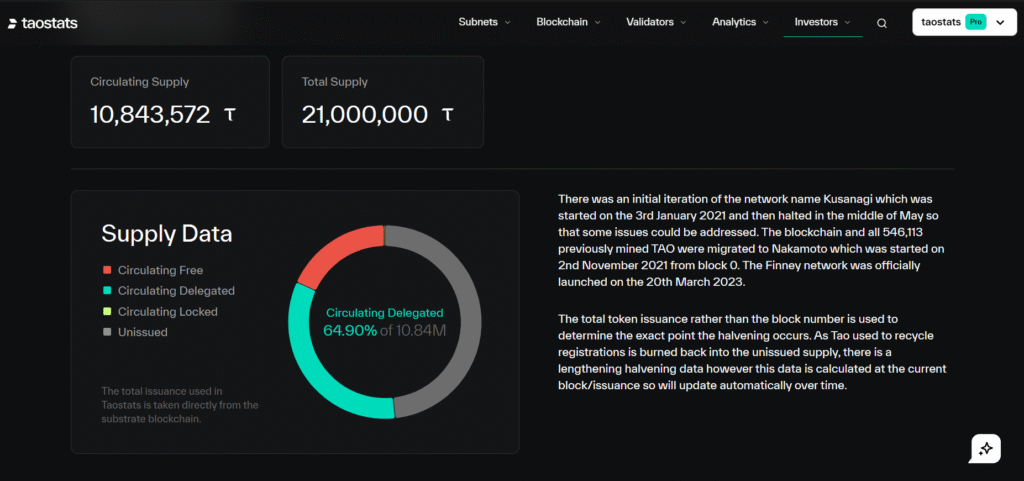
a. Supply Dynamics: Circulating supply tells you how much $TAO is actively in the market, and Supply Distribution shows what form it’s being held and how it is spread across the ecosystem.
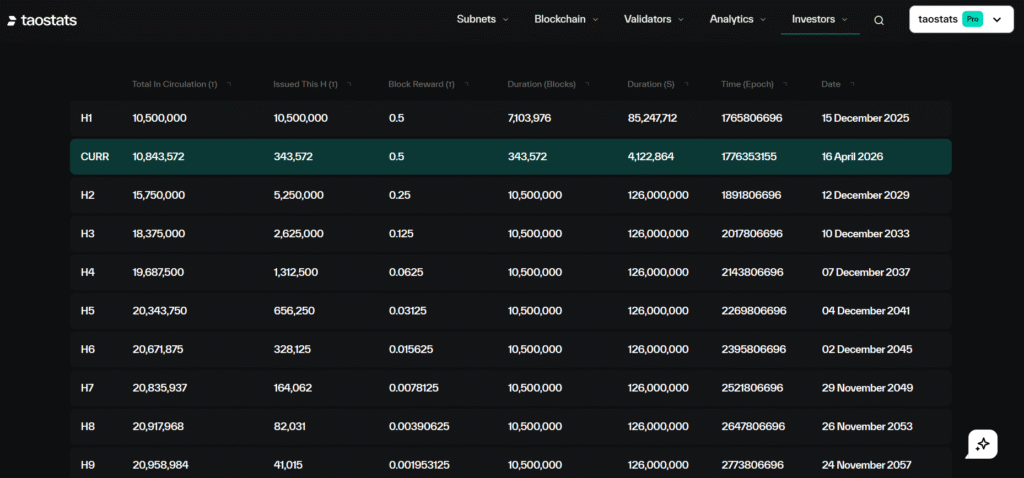
b. Halving Structure: Historical halving data reveals how emissions have evolved over time, and the next halving projection tells you when issuance will tighten, which directly impacts long-term scarcity and valuation pressure.
If you skip this step, you lose context. Subnet ‘$ALPHA’ tokens do not exist in isolation, they inherit their monetary gravity from $TAO’s emission schedule and distribution logic.
The Subnet Snapshot: Pricing and Core Financials
Once you open a subnet page, the first thing you encounter is a real-time view of its native token, typically referred to as $ALPHA. This is where most people fixate, but price alone is the least informative metric unless you understand what sits behind it.
Here is how to read this section properly:
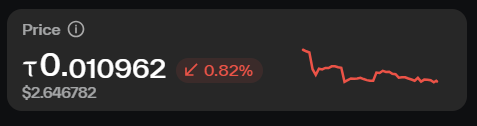
a. Dual Pricing: $ALPHA is priced in both $TAO and $USD, which allows you to separate subnet performance from broader market movements.
If $ALPHA rises in $USD but falls against $TAO, the subnet may actually be underperforming relative to the network.
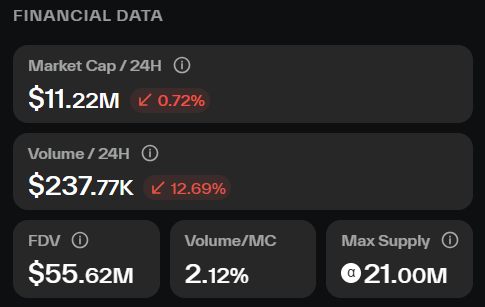
b. Financial Data Bar: This focuses on structure, not just numbers:
1. Market cap reflects current valuation,
2. FDV (Fully-Diluted Valuation) shows what the token would be worth if all supply were active,
3. Volume indicates how actively the market is trading the asset,
4. Volume to market cap ratio helps you gauge liquidity versus speculation, and
5. Max. supply defines the theoretical ceiling of issuance.
c. Supply Mechanics: This is where things get more interesting:
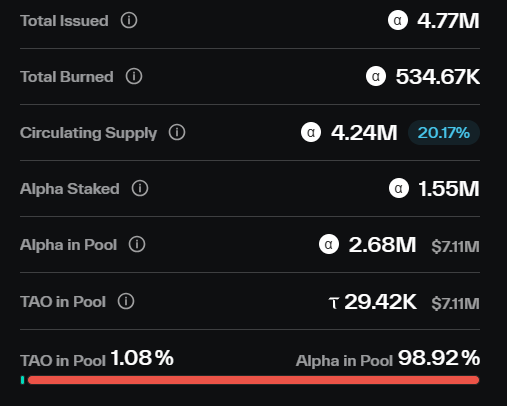
1. Total issued includes everything ever emitted, including burned tokens,
2. Total burned shows how much supply has been permanently removed,
3. Circulating supply is what is actually tradable,
4. Staked $ALPHA reflects how much is locked for governance or yield, and
5. Pool balances in $ALPHA and $TAO reveal the liquidity backing the market.
Taken together, this section answers a simple but critical question: is this token scarce, liquid, and actively used, or is it inflated, illiquid, and stagnant?
Trading Behavior: What the Market Is Actually Doing
Price tells you where the market is, but trading data tells you how it got there. This section is often overlooked, yet it provides one of the clearest signals of sentiment and participation quality.
Here is what to look for:
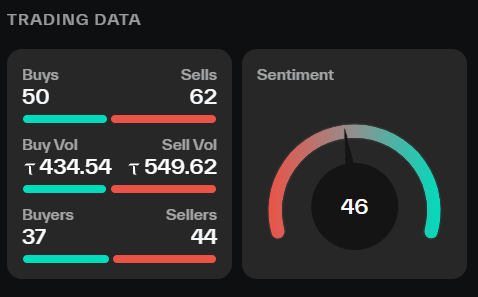
a. Order Flow: This shows the number of buys versus sells shows directional pressure, and the volume in $TAO terms gives you a normalized measure of activity across subnets.
b. Participant Breakdown: Shows the number of buyers and sellers which indicates whether activity is broad or concentrated.
A high volume driven by very few participants can signal fragility.
c. Sentiment Indicator: This aggregates trading behavior into a directional bias, helping you quickly assess whether the market is leaning optimistic or defensive.
The key is not to react emotionally to this data, but to interpret it structurally. Healthy markets tend to show balanced participation with consistent volume, while unstable ones often display sharp imbalances and thin liquidity.
Subnet Mechanics: Where Value Is Actually Distributed
This is the section that most directly reflects how a subnet functions as an economic system. Everything here is denominated in $TAO, reinforcing that all incentives ultimately flow from the base network.
Break it down like this:
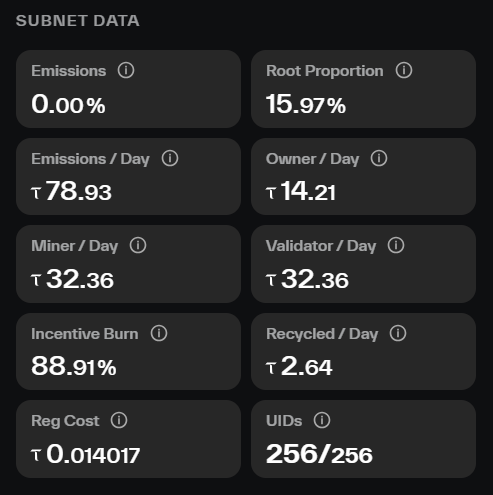
a. Emission Structure: shows how total emissions define how much value the subnet distributes, and how much emissions per day give you the pace of that distribution.
b. Allocation Breakdown gives the ‘owner share’ that shows what the subnet creator earns, miner share that reflects rewards for producing useful work, and ‘validator share’ that captures rewards for evaluating and securing that work.
c. Economic Controls gives details on ‘incentive burn’ of tokens removed from circulation, tightening supply, and recycled emissions that show how value is reintroduced into the system.
d. Operational Metrics like registration cost affects how easy it is to join the subnet as a miner or validator, and UIDs that present the number of active participants, which gives a rough sense of network scale.
This section answers the most important question of all: who gets paid, for what, and how consistently?
Reading the Page Like an Investor, Not an Analyst
If you approach Taostats like a spreadsheet, you will get buried in the ocean of numbers. If you approach it like a system, you start to see patterns that actually matter.
A clean mental checklist helps:
a. Start with $TAO to understand the macro supply environment,
b. Move to subnet pricing to gauge relative performance,
c. Analyze financials to understand structure and liquidity,
d. Read trading data to interpret sentiment and participation, and
e. Finish with emissions to understand incentive alignment.
At that point, you are no longer just looking at numbers, you are evaluating a living market system that continuously balances supply, demand, and contribution.
The edge is not in memorizing every metric, but in knowing which ones tell you something real about value creation. Once that clicks, Taostats stops being intimidating and starts becoming one of the most useful tools in the entire Bittensor ecosystem.
Enjoyed this article? Join our newsletter
Get the latest TAO & Bittensor news straight to your inbox.
We respect your privacy. Unsubscribe anytime.
Enjoyed this article?
Join our newsletter
Get the latest TAO & Bittensor news straight to your inbox — every morning before markets open.


Be the first to comment