
Lately, Bittensor has been making headlines for both good and not so good reasons. Love it or hate it, Bittensor is one of the rare projects that survives bear markets. That is not a coincidence or pure speculation. Beneath the surface, the Bittensor ecosystem has never been more mature and productive. While the fundamentals are already well covered by people like @taodaily_io, @VictorVL_EN or @CryptoZPunisher, the financial metrics of Bittensor rarely get the attention they deserve. Yet they are just as surprising.
Today, let’s dive into the data to understand why TAO is not just another token and why it deserves a long-term place in your crypto portfolio.
Bittensor alone against the world
Most people treat TAO like just another altcoin.
In practice, it does not behave like one at all.
One of the most relevant metrics to measure the uniqueness of a project is its correlation with BTC. A highly correlated asset is nothing more than a proxy and will not help you diversify your portfolio. Most altcoins have a correlation with BTC between 45% and 80%. They simply follow the king’s moves.
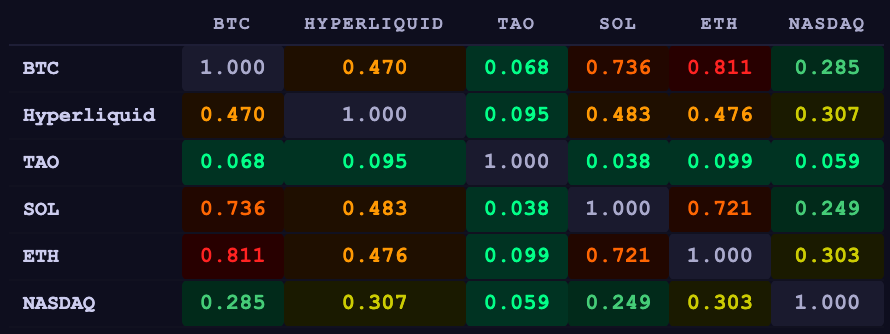
TAO is different. Its correlation with BTC is just 6.7%. It is virtually immune to Bitcoin’s moves. Even when smoothing the data weekly, the correlation barely reaches 9% which is still low. I also looked for a lagged correlation (whether TAO reacts 1, 2 or 3 weeks after BTC moves), but the results showed an even weaker relationship than the daily one. TAO does not follow BTC with a delay either. And for the little correlation that does exist, it works in your favor. Since dTAO, TAO captures 26% of Bitcoin’s upside moves but only absorbs 15% of its downside.
Since Bittensor is fundamentally about artificial intelligence, one might expect it to at least track the Nasdaq, which groups the biggest players in the sector. In practice, the daily correlation between the Nasdaq and TAO sits at just 5.9%. Combined with its near-zero overall correlation, this makes TAO a genuinely atypical asset with an attractive risk/reward profile.
Performance
Before dTAO
The Compound Annual Growth Rate (CAGR) since the Bitget listing stands at 41.2%. That means TAO appreciated by roughly 40% per year since it first hit the exchange. For comparison, BTC delivered a 46% CAGR over the same period.
Similar performance on paper, but the risk taken by early holders was not quite the same. To measure the risk/reward profile, we can use the well known Sharpe Ratio. From the Bitget listing to the dTAO upgrade, the ratio came in at -0.02. In other words, the returns did not compensate for the volatility risk taken. That is not surprising. The early years of any asset are always the most volatile and uncertain, driven by market size but also by protocol evolution. And when it comes to meaningful milestones for Bittensor, the dTAO upgrade in February 2025 stands out above all.
After dTAO
The dTAO upgrade brought the network to a new stage of maturity. It also held up remarkably well during the broader market downturn.
While the annualized return sits at -28%, it remains solid compared to BTC which posted -23% over the same period. When factoring in root staking at 7.5% (and even higher in the early days), TAO’s annualized return improves to -20%, surpassing BTC’s performance.
As a result, for every 1% of additional risk taken on TAO relative to Bitcoin since the dTAO launch, investors were rewarded with 1.13% of excess return. The risk paid off slightly, and the effects of the dTAO upgrade are already visible in the numbers.
For the rest of this analysis, we will focus on the post-dTAO period, which is more representative of the current ecosystem.
Volatility
If you hold TAO, you already know Bittensor is a volatile asset. To be more precise, its annualized volatility stands at 125%, meaning that over a year, TAO’s price typically fluctuates by ±125% around its average return, compared to 46% for BTC. Put simply, a typical TAO day moves ±6.5%, which is 2.7x more volatile than Bitcoin and 8x more than the S&P 500.
But looking more closely, this volatility actually works in TAO’s favor.
Since the dTAO upgrade, TAO goes down more often than it goes up. 52% of days are in the red.
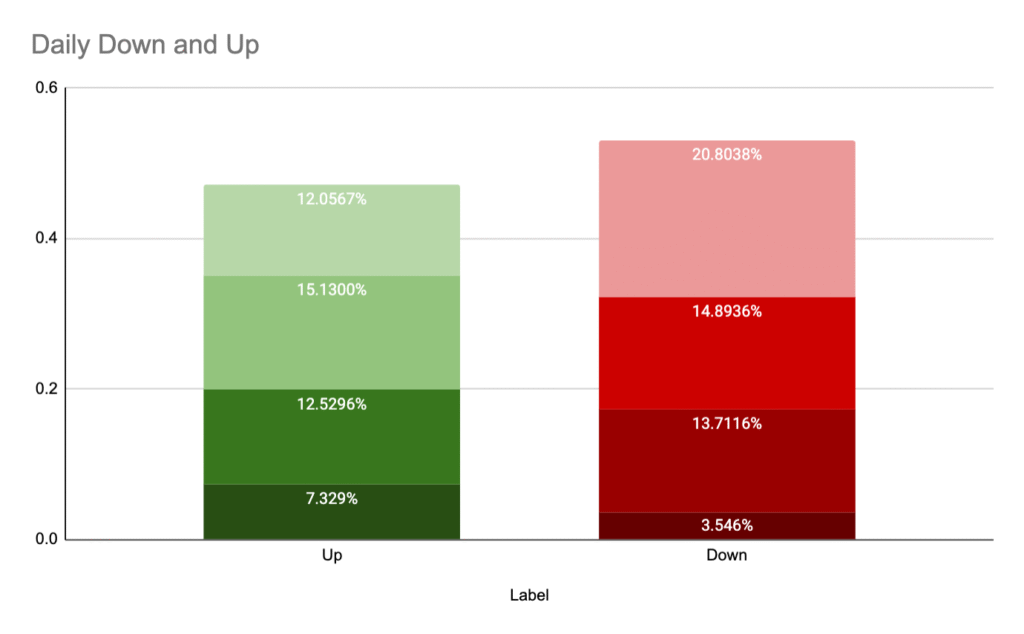
At first glance, this sounds negative. But to truly understand what this means, you need to look at the magnitude of the moves. And that is where everything changes.
Bittensor is positively asymmetric. This asymmetry is what drives long term performance.
It goes up harder than it goes down: +5.5% on average on up days versus -4.3% on down days. The Sharpe Ratio gave us a sense of the return relative to risk, but it tends to penalize volatility across the board and more importantly, it does not account for this asymmetry.
Yet as we have seen, TAO is both volatile and asymmetric. To capture this properly, let’s look at the Omega Ratio.
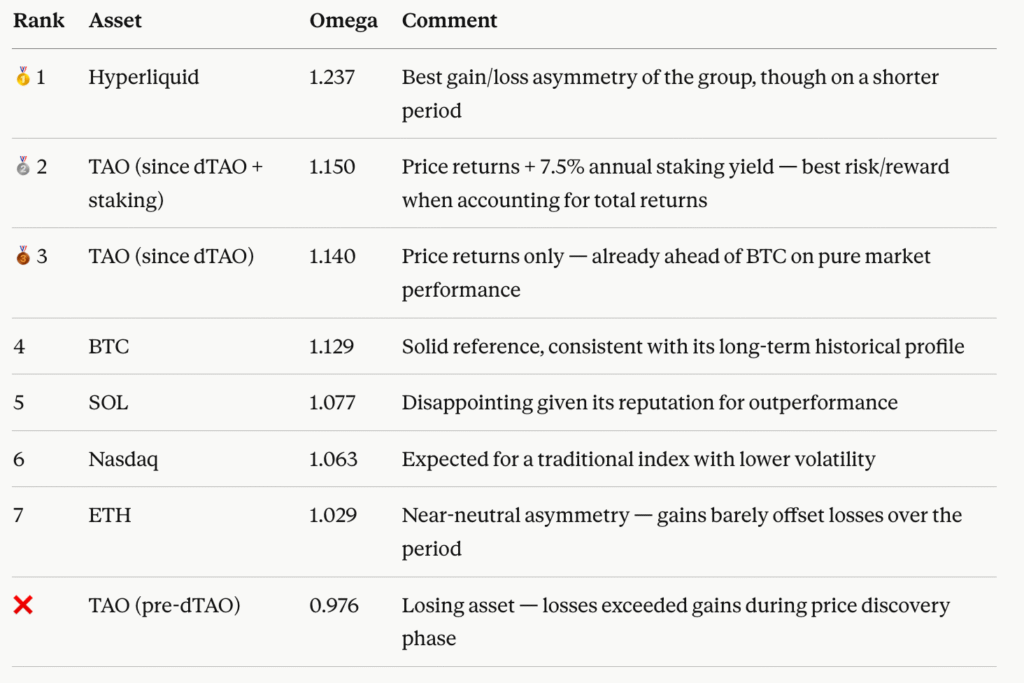
Since the dTAO upgrade, TAO ranks 2nd out of 6 assets on the Omega Ratio, ahead of Bitcoin, Solana, Ethereum and the Nasdaq. For every $1 lost, TAO generated $1.14 in gains ($1.15 if you are staking on root), a structural improvement from the pre-dTAO period where losses exceeded gains.
This also does not include the gains you can get through subnet valuation and APY.
Modeling TAO’s Long-Term Trajectory
To make sense of all this, I tried to model an underlying trend for long-term projection.
The R² comes in at 0.492. Not exceptional, but solid enough to build a working framework that will sharpen over time. For the non-initiated, an R² of this value means the model explains 49% of TAO’s price variations over the period. That is a reasonable level of predictability given how young the asset is and its 125% volatility.
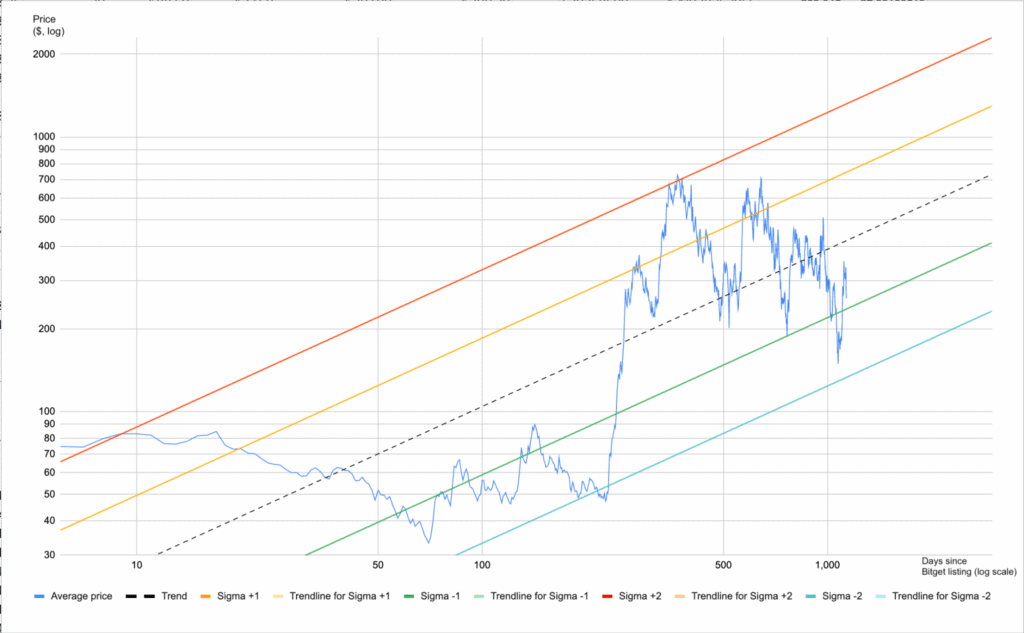
According to the model, TAO has an average volatility of ±77% around its trend. These results factor in the early days when the price corrected sharply following its first CEX listings, including Bitget. Think of this as a structural volatility, one that tries to filter out the short-term noise we covered earlier (125%).
If the model holds, volatility should compress around this trend over the years. The current equilibrium price would therefore sit around $420.
Conclusion
Bittensor is not a regular altcoin. With a correlation of 6.7% to Bitcoin and 5.9% to centralized AI, it moves to the beat of its own drum, driven by the emergence of decentralized AI as a new economic primitive.
At 125% annualized volatility, TAO may look risky. The data tells a different story. TAO is fundamentally asymmetric. It wins more than it loses. Its Omega Ratio of 1.14 since dTAO confirms it: for every $1 lost, TAO has generated $1.14 in gains, ranking it ahead of Bitcoin, Ethereum, Solana and the Nasdaq. High volatility in an asymmetric asset is not risky. It is an opportunity. And on top of price returns, root staking delivers an additional 6-9% APY, with subnet allocation offering further upside for those willing to go deeper into the ecosystem.
The numbers do not lie. TAO is not a bet on crypto. It is a bet on the future of intelligence itself.
The patient will be rewarded.
Enjoyed this article? Join our newsletter
Get the latest TAO & Bittensor news straight to your inbox.
We respect your privacy. Unsubscribe anytime.
Enjoyed this article?
Join our newsletter
Get the latest TAO & Bittensor news straight to your inbox — every morning before markets open.


Be the first to comment