

TAO Templar published a video explaining what he calls “the subnet arc,” a price shape so consistent across Bittensor that he treats it as the default story rather than the exception.
The arc? A sharp initial pump driven by hype, then a slow decline that often lasts months. Sometimes a second pump follows, sometimes not, but the first leg is almost universal.
The thesis of the video is that recognizing where a subnet sits inside the arc matters far more than picking the “right” subnet in the first place.
The Shape Repeats
TAO Templar drew the arc at the start of the video as a casual line on a blank chart, then pulled up subnet after subnet that matched it almost exactly.
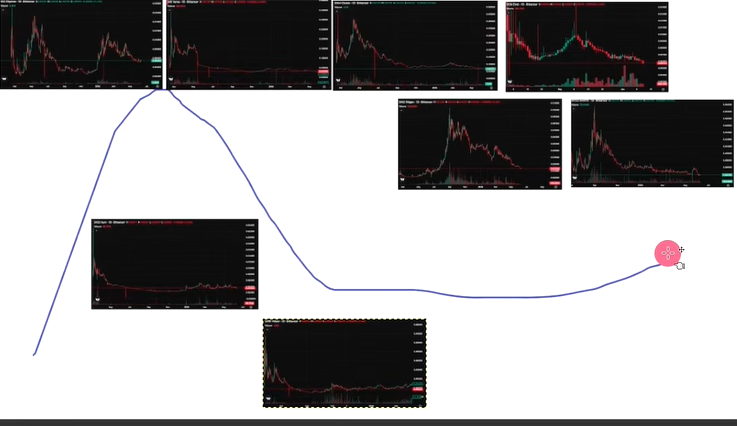
He covered more than ten in the video, spanning early registrations, named launches with strong narratives, two recovery cases, and a fresh one still in its early pump phase.
The pattern holds across categories:
1. Early registrations from the dynamic $TAO era. Multiple subnets that launched around dynamic $TAO show the full curve: pump, peak, then slow decline.
2. Subnets with strong narratives at launch. Even subnets that pumped on a clearly compelling thesis (open-source code generation, novel mechanism design) followed the same trajectory after the peak.
3. Subnets that completed full cycles. A few of the older subnets have already gone through more than one pump-and-decline cycle, with the second pump driven by a real fundamentals event like revenue offsetting miner emissions for the first time.
4. The freshest registrations. Subnets that just registered show the early pump phase already in progress.
The point is not that any individual subnet is doomed. It is that the price shape is so consistent across the dataset that treating each new pump as a unique opportunity ignores what the chart is actually telling you.
The arc happens whether the team is good or not, whether the technology is real or not, and whether revenue is materializing or not.
The Mechanics Behind the Curve
TAO Templar is open about not knowing every reason the arc plays out this way, but he offers a few theories alongside what he has seen in the data.
The drivers he names:
1. APY (Annual Percentage Yield) pulls attention in, but the math rarely works. New subnets often launch at very high APY numbers. A 100% APY does nothing for the holder if the price falls 50% in the same window, which is a recurring pattern.
2. OTCs (Over-the-Counter) and owner sales accelerate the decline. Some declines get amplified by subnet owners selling to cover operating expenses. Travis notes this is part of the story but not all of it, since the same shape appears on subnets where these sales are not happening visibly.
3. The next subnet is always launching. As one subnet’s hype phase ends, capital rotates into the next subnet entering its hype phase. The exit reflects how attention moves across the ecosystem, not necessarily a verdict on the project being exited.
4. Liquidity is thin early. During the initial pump, liquidity in a subnet is generally lower, which makes early entries hard to execute and even harder to exit cleanly.
The larger point is that the arc is not really about any individual subnet. It is about how attention and capital move through the Bittensor ecosystem, and most subnets are subjected to the same flow regardless of their fundamentals.
Two Ways In
The actionable part of the video is the section where TAO Templar broke down how to trade the arc rather than fight it. He uses two entry zones, with sharply different risk profiles.
The first zone is the early pump. Catching it requires understanding what a subnet does before the market fully prices it in. TAO Templar described one trade where he caught a subnet at roughly half its eventual peak and sold near a doubling of his entry, missing the upside that followed but avoiding the 86% drawdown after the peak. He was honest about the risk: he does not always know how high the hype will go, and some subnets do not get the second-leg pump at all.
The second zone, which is his preferred play, is well into the slow decline. He buys only when specific fundamentals are visibly improving alongside the falling price. The signals he looks for in this phase:
1. Is the team still shipping? A team continuing to build through a drawdown is the strongest single signal.
2. Is the product getting better? Tooling improvements, mechanism upgrades, and miner economics getting cleaner are the kinds of changes he tracks.
3. Is revenue real? Subnets approaching or crossing full revenue offset of miner emissions are the cleanest fundamentals story he watches.
4. Where is the price relative to the original pump? A subnet that has fallen back near its pre-hype level often signals the decline has likely run its course.
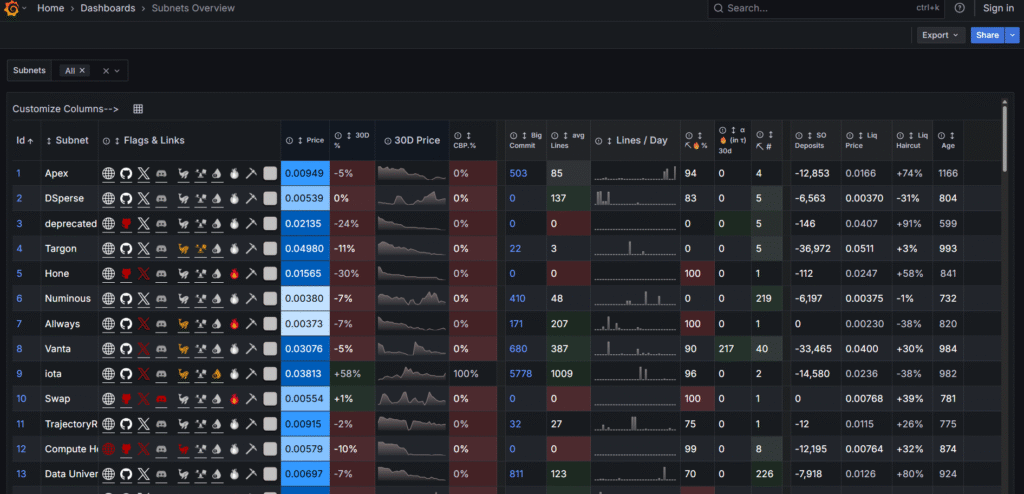
His tooling for finding candidates is TAOFlute, where he filters by recent burns to identify subnets that are reinvesting in themselves, then uses liquidation haircut as a proxy for downside risk.
Past the First Pump
The most useful part of TAO Templar’s video is the question it changes. Most subnet analysis focuses on which subnet to pick. The argument is that the harder question is when in the arc to enter, because almost every subnet follows the same shape and most early entries lose money even when the project itself is sound.
The discipline is patience: wait for the decline, look for the fundamentals that show up during it, and take a serious position while everyone else is bored. The arc is not predictive in the strict sense, but it is consistent enough that treating it as the default story will save more money than chasing the next hyped registration.
Enjoyed this article? Join our newsletter
Get the latest TAO & Bittensor news straight to your inbox.
We respect your privacy. Unsubscribe anytime.


Be the first to comment