Anyone who’s been around Bittensor long enough knows the ritual. Taostats open in one tab, a subnet dashboard in another, wallet in a third, maybe a spreadsheet on the side, and you start clicking around trying to figure out what’s happening. By the time you’ve pieced together a half-decent picture, the momentum has dried up, and you might have missed another runner.
128 subnets will do that to a person.
Tensia Foundation, a team building open tools for the Bittensor ecosystem, has just launched a solution that directly tackles this pain point: Tensia.Bubbles.
The CryptoBubbles Revolution, and Why Bittensor Needed Its Own Version
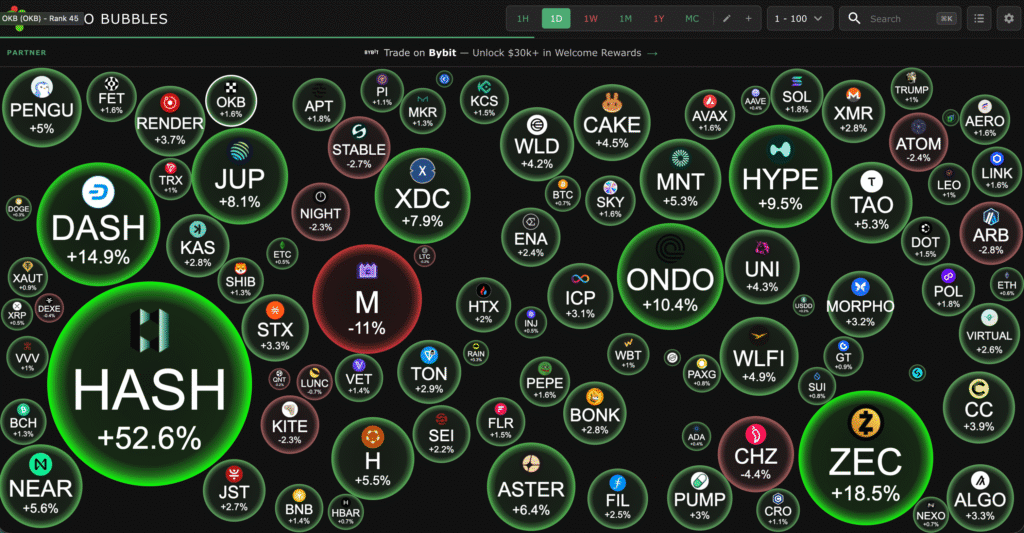
The rest of crypto figured this out years ago. If you’ve never used CryptoBubbles, the idea is simple: take the entire market and turn it into a screen full of floating bubbles. Bigger bubble, bigger market cap. Green means up, red means down. Pick your timeframe, 1H, 24H, 7D, and the whole screen rearranges itself. One glance and you know who’s pumping, who’s bleeding, where the heat is.
It’s the fastest way to read market sentiment at a glance. Traders have relied on it for years because it compresses thousands of data points into an intuitive, visual map. It killed the spreadsheets; people stopped reading the market and started looking at the bubbles.
Bittensor never had its version (especially with the 3D and personal wallet feature). Until this week.
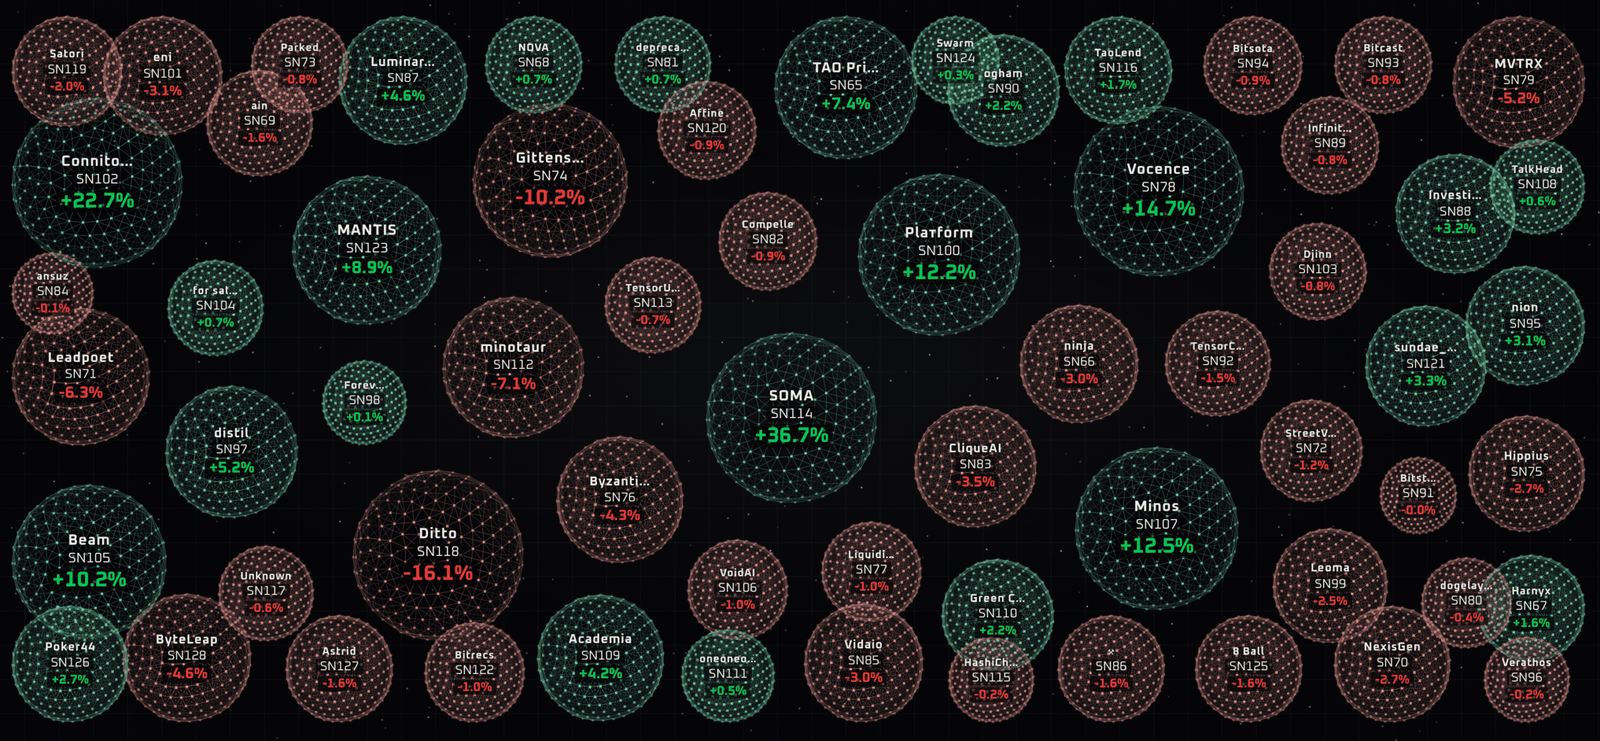
While the broader crypto market enjoyed CryptoBubbles, Bittensor participants were left piecing together subnet data from raw on-chain explorers. This lack of a holistic visual layer made it far harder to answer simple but critical questions: Which subnets are gaining traction right now? How is my dTAO bag doing right now? Where is real momentum building?
Introducing Tensia.Bubbles: Your Bittensor Portfolio, Visualized in 3D
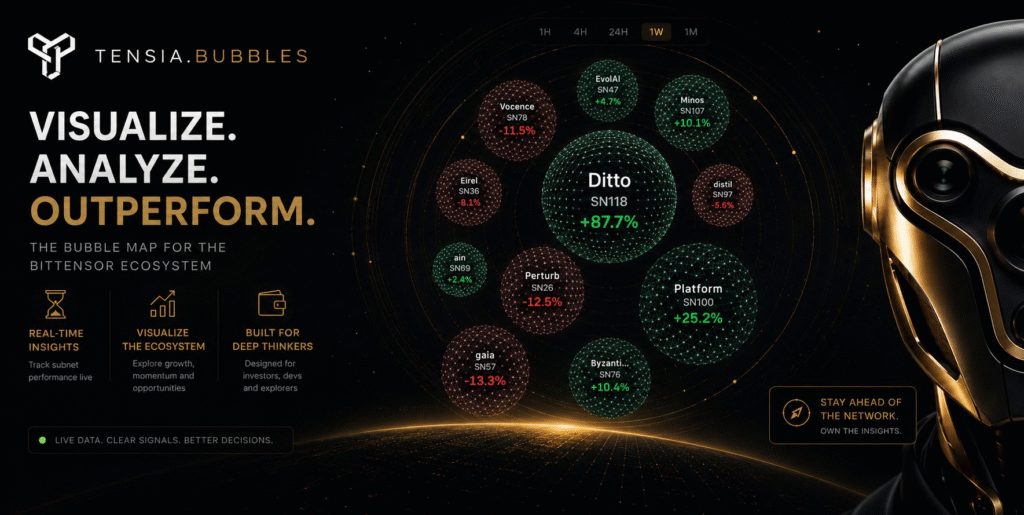
Tensia.Bubbles takes the beloved CryptoBubbles concept and adapts it specifically for Bittensor’s unique architecture, and then levels it up with immersive 3D interactivity.
Here’s exactly how it works:
- One-screen overview of the entire network: Every live subnet appears as a dynamic 3D bubble floating in navigable space.
- Instant metric switching: Toggle between market cap / stake (bubble size) and variation / performance (bubble color). The entire map reshapes in real time as you switch.
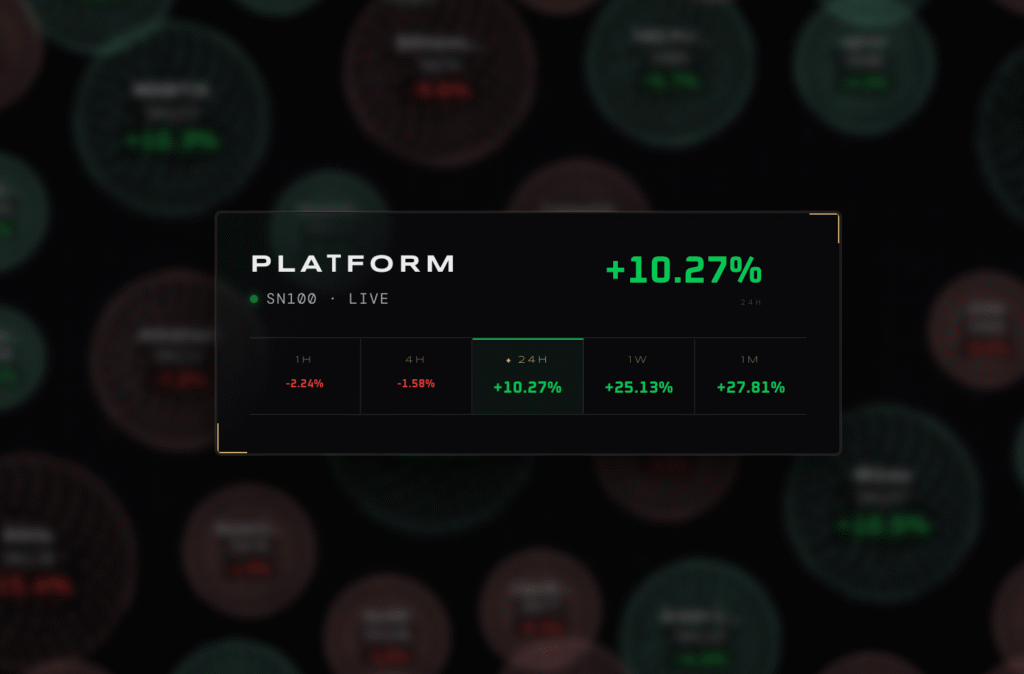
- Flexible time windows: Choose 1H, 4H, 24H, 1W, or 1M. The bubbles and colors update immediately to reflect performance over your selected period.
- Personalized wallet filter: Paste your address. The view collapses down to only the subnets where you’re holding. Your entire TAO position and subnets you maybe forgot you bought into, snaps into a single panel. Your entire Bittensor portfolio becomes visible in a single, glanceable map. No other tool has made this possible.
The interface is clean, futuristic, and deliberately immersive. Subnet names and identifiers (e.g., “Ditto SN118”) float alongside each bubble, with clear percentage gains/losses displayed. It’s designed to feel like stepping inside the network rather than staring at a dashboard.
Clarity Is Alpha
Most of us have never seen our TAO bag in the most revealing way. We’ve seen rows. We’ve seen numbers in a column. But we’ve never seen the shape of the portfolio itself.
Tensia.Bubbles is live now at bubble.tensia.foundation. Free, no signup. Paste your wallet, spin the map, and enjoy the clarity you so much deserve.
Enjoyed this article? Join our newsletter
Get the latest TAO & Bittensor news straight to your inbox.
We respect your privacy. Unsubscribe anytime.
Enjoyed this article?
Join our newsletter
Get the latest TAO & Bittensor news straight to your inbox — every morning before markets open.


Be the first to comment