

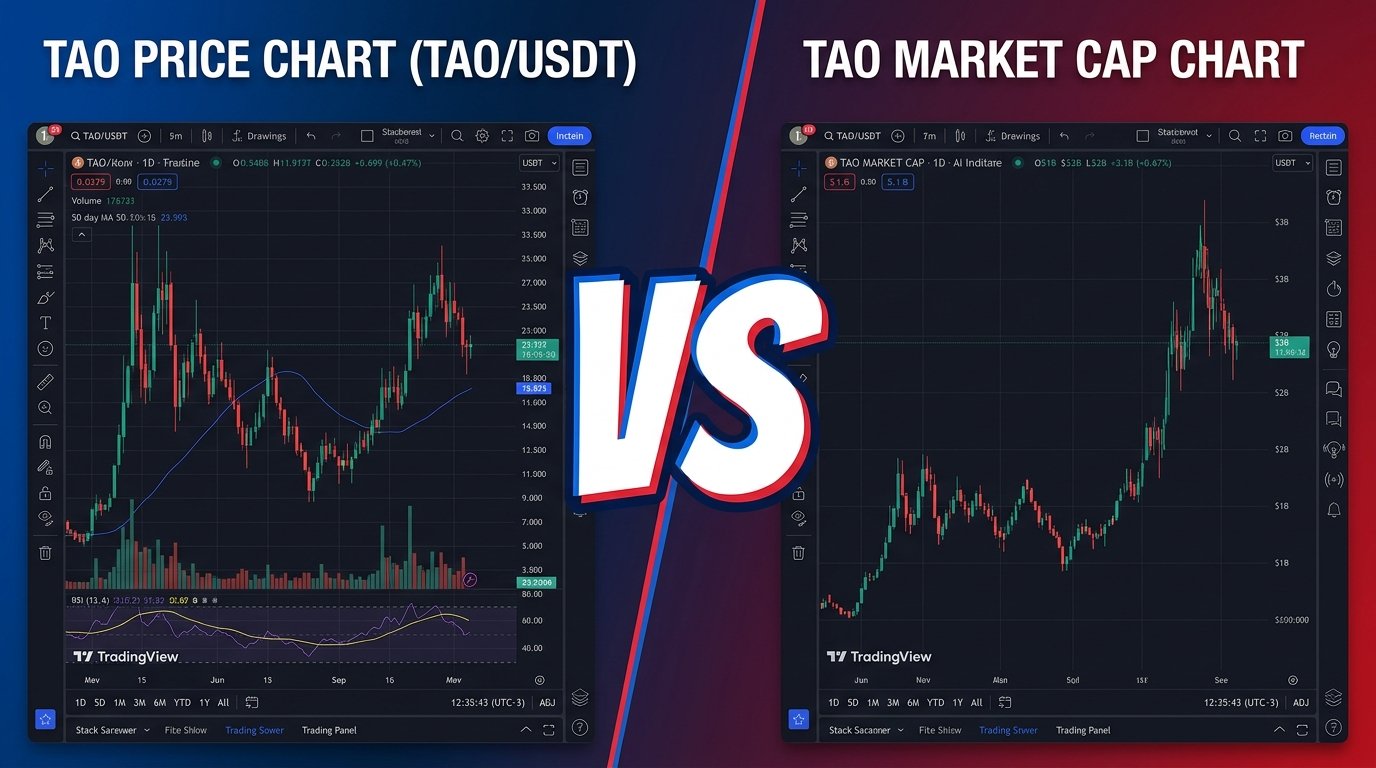
If you want to know how $TAO is really performing, there is another chart you should be watching besides price:
Market cap.
That might sound insignificant, but it deserves consideration because TAO is still adding thousands of new tokens to its supply every day.
When supply is changing this quickly, the price of one TAO does not tell the whole story.
Price vs. market cap
Here’s how market cap is being calculated:
Market cap = price × circulating supply
Price tells you what one TAO is worth.
Market cap tells you what the market is valuing the entire TAO supply at.
That makes market cap particularly useful for an asset like TAO, where the number of tokens in circulation is growing significantly in real time.
Imagine TAO falls from $400 to $300.
Looking only at the price chart, that’s a 25% decline.
But if the number of TAO in circulation increased substantially during the same period, the network’s market cap may have fallen by much less, or potentially not at all.
The price fell, but the value assigned to the network didn’t necessarily fall by the same amount.
This is where TAO differs from Bitcoin and Zcash
The comparison with Bitcoin or Zcash can be misleading.
All three have the same 21 million maximum supply, but they are at very different stages of issuance.
Bitcoin has already issued ~95% of its supply. Zcash has issued ~80%. TAO is only around half issued.
Bitcoin’s supply is now growing extremely slowly. Zcash is further along too, with the current inflation rate for both coins very low. TAO, meanwhile, only completed its first halving in December 2025, cutting the block reward from 1 TAO to 0.5 TAO.
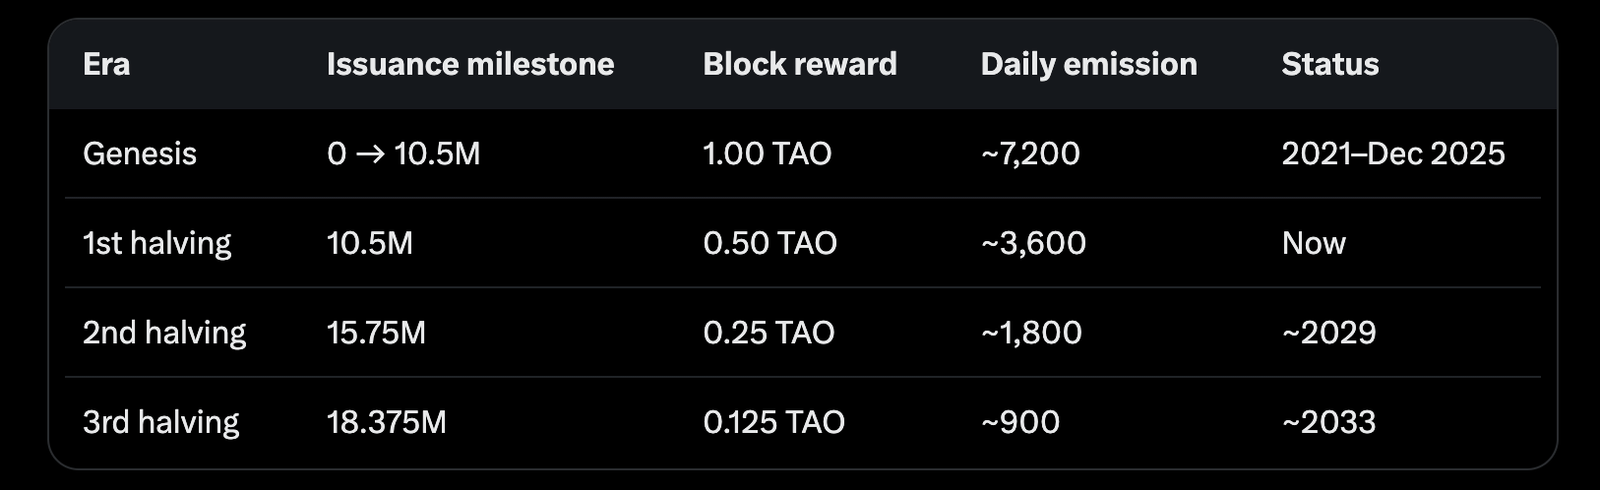
Thousands of new TAO are still entering circulation every day.
So while price and market cap tend to move much more closely together for an asset like BTC and ZEC, TAO still has a significant amount of supply growth happening underneath the price chart.
Why this changes how you read TAO
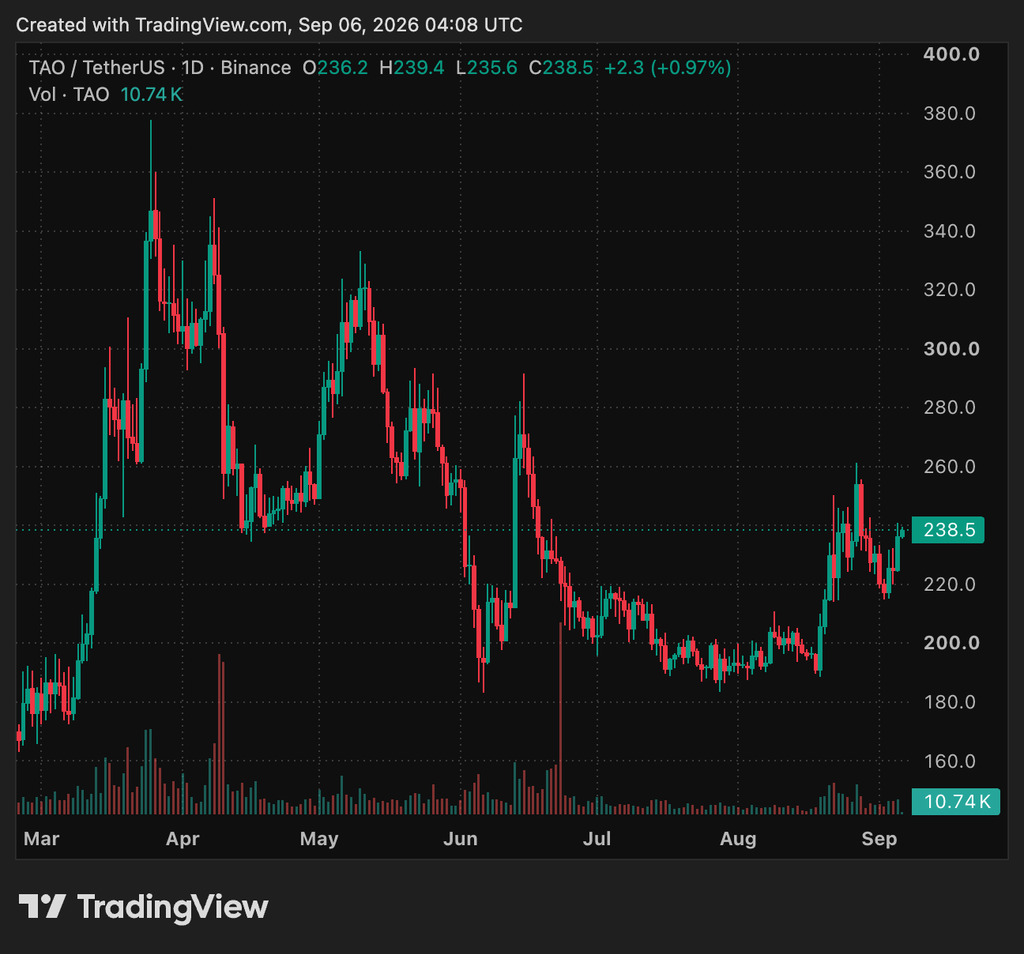
Consider TAO’s old all-time high.
TAO reached roughly $757–$760 in 2024.
If TAO returned to $757 today, it wouldn’t represent the same market value as it did back then because there are now significantly more TAO in circulation.
With roughly 11.2 million TAO circulating, a $757 price would imply a market cap of around $8.5 billion today.
The same price at the lower supply of 2024 represented a much smaller network valuation (~$5 billion).
So saying “TAO is still 70% below its all-time high” doesn’t tell the entire story.
The more useful question is:
How far is TAO’s market cap from its previous high?
That’s where the extra supply becomes visible.
Where to find TAO’s market cap chart
If you want to see TAO’s market cap for yourself, TradingView has it available under TAOB.
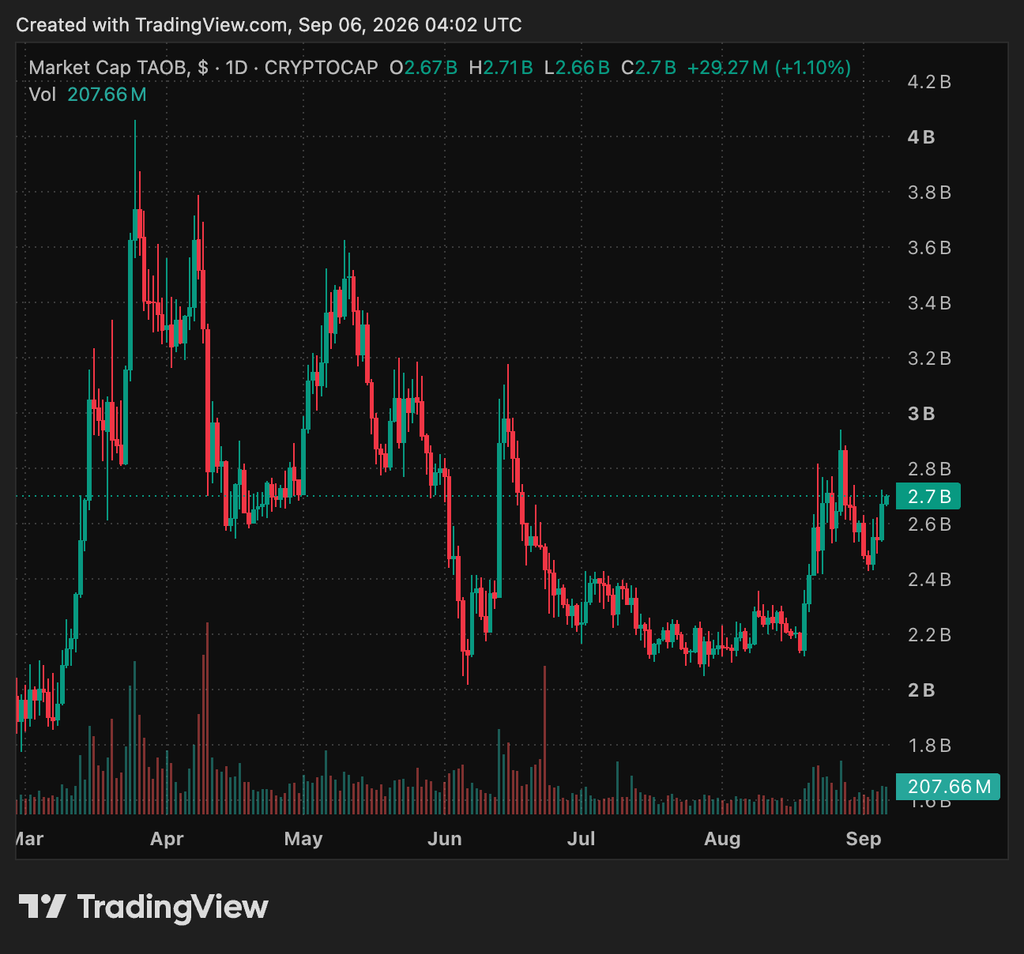
You can also simply search TAOB on TradingView.
The chart is worth keeping alongside TAO’s price chart. It gives you a better sense of whether the network is losing value, or whether price is being pulled down partly by the continued growth in TAO’s supply.
And right now, there’s an interesting observation: TAO’s market cap has not made a new low during this bear market, despite the token still being highly inflationary.
So which chart should you watch?
Both.
The price chart is still important. It’s what traders buy and sell.
But for an asset that is still issuing thousands of tokens every day, market cap gives you an important piece of information that the price chart leaves out.
It tells you whether the market is putting more or less total value on TAO, which is beyond telling you what one unit costs.
TAO is still early in its supply curve. Until issuance becomes much smaller, market cap may be the better starting point for judging how the token is performing.
Enjoyed this article? Join our newsletter
Get the latest TAO & Bittensor news straight to your inbox.
We respect your privacy. Unsubscribe anytime.
Enjoyed this article?
Join our newsletter
Get the latest TAO & Bittensor news straight to your inbox — every morning before markets open.



No comments yet — be the first.