

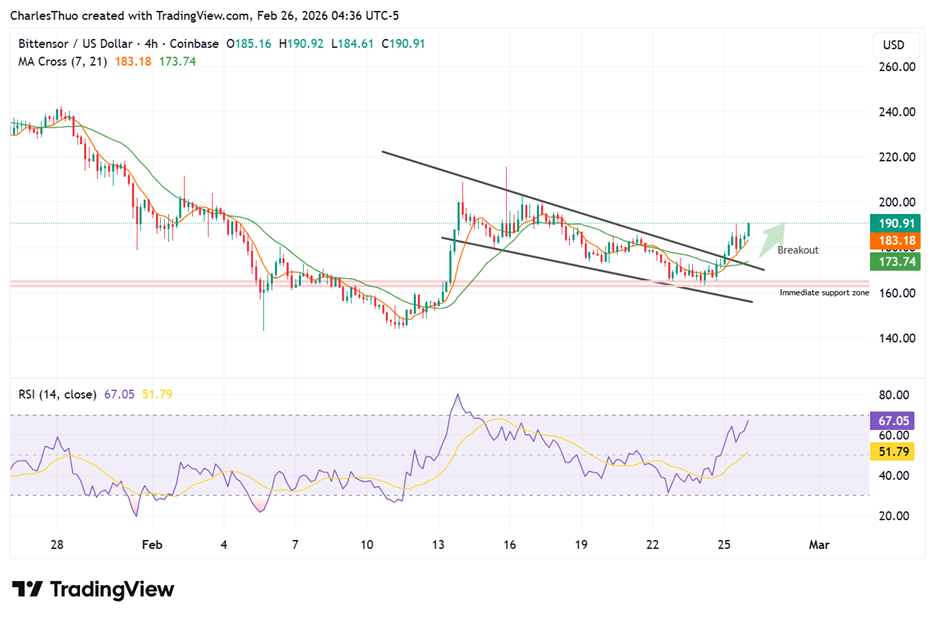
After weeks of tightening price action and fading volatility, Bittensor has finally made its move. The native token of Bittensor, $TAO, has broken out of a well-defined falling wedge pattern on the four-hour (4H) chart, shifting short-term momentum from defensive to constructive.

What makes this breakout compelling is not just the pattern itself, but the context in which it formed. This was not a random spike, it followed a prolonged compression phase near the lower boundary of a broader descending channel, where supply was steadily absorbed and downside momentum gradually weakened.
When breakouts occur after extended consolidation, they tend to carry more structural weight. That is the backdrop $TAO now trades against.
From Correction to Early Recovery
$TAO remains well below its historical highs, reflecting the depth of the broader correction across digital assets. Yet, recent price behavior suggests that the most aggressive phase of selling has already passed.
The $163 to $165 region has acted as a reliable accumulation shelf. Multiple tests of that zone were met with steady buying rather than emotional liquidation. Each dip was absorbed with increasing efficiency, forming a technical base that traders had been monitoring closely.
The falling wedge formation reinforced this narrative. By definition, a falling wedge develops when price continues to drift lower while selling pressure progressively loses intensity. Lower highs compress into a narrowing structure, and when price breaks above the upper boundary, it often signals the transition from correction to recovery.
That is precisely the technical shift $TAO is now attempting to confirm.
The Technical Structure That Matters
There are three structural elements supporting the current move:
a. Prolonged consolidation inside a descending channel: Rather than collapsing vertically, $TAO carved out a measured range, cooling volatility and allowing supply to rotate into stronger hands,
b. Repeated defense of key horizontal support: The $163 to $165 zone has proven resilient, reinforcing the idea of accumulation rather than distribution, and
c. A clean falling wedge breakout on the 4H timeframe: The breakout did not occur in isolation. It emerged after momentum had already begun to stabilize.
Taken together, this is less of a relief bounce and more of a technically coherent recovery attempt.
The Next Resistance Zones to Watch
Breakouts only matter if they sustain follow through. The first major test lies near the mid-range of the broader descending channel. Previous rallies lost momentum in that region, making it a natural checkpoint for bulls.
A decisive push through that level would open the path toward the more significant descending resistance between $230 and $240.
That upper band aligns with prior rejection points and represents the structural ceiling of the current channel. From present levels, a move into that range would imply roughly 25% to 40% upside, a projection that aligns with the measured size of the wedge and the duration of consolidation.
However, continuation is conditional. If price fails to hold above the former wedge boundary and slips back into the structure, the breakout risks becoming a false signal.
In that scenario, focus would return to lower support levels and range continuation.
Risks That Cannot Be Ignored
Despite the improved short-term picture, $TAO remains below key long-term moving averages on higher timeframes. That means the macro trend is still cautious rather than fully bullish.
Additionally, $TAO does not trade in isolation. Broader market conditions, particularly the trajectory of Bitcoin ($BTC) and overall risk appetite across crypto will influence whether this breakout evolves into a sustained trend.
Key risks include:
a. A broader market pullback that suppresses momentum,
b. Failure to maintain reclaimed resistance as support, and
c. Weak follow through volume after the breakout.
For now, the technical posture favors patience over euphoria.
How High Can $TAO Go
The answer depends less on prediction and more on structure. If buyers continue to defend reclaimed levels and gradually expand price into higher resistance bands, the recovery thesis strengthens. A move toward $230 to $240 becomes technically reasonable within the existing framework.
If momentum fades and the breakout fails, the market likely returns to range bound conditions.
What is clear, however, is that $TAO is no longer exhibiting the aggressive distribution seen earlier in the year. Price behavior has shifted from capitulation to stabilization, and from stabilization toward early recovery.
In markets, that transition is often where the real trend begins.
For now, Bittensor has reclaimed initiative. Whether it transforms into a sustained rally will depend on one thing: its ability to build higher structure without surrendering the base it just defended.


Be the first to comment