

What is TAO Tensor Law?
TAO Tensor Law is a free website that tracks TAO’s price using math patterns. It’s a simple model designed to help anyone understand the long-term behavior of TAO, the native token of the Bittensor network. Like a weather forecast, but for TAO prices.
The tool uses something called a “logarithmic power law regression,” which is just a math formula that finds patterns in how TAO’s price has moved over time. Then it draws lines showing where TAO “should be” based on history.

Instead of looking at daily noise and random price swings, the model tries to show:
- the long-term trend,
- the “fair value” of TAO, and
- whether the current price is above or below that fair value.
It does this by comparing TAO’s price history to a smooth mathematical curve.
The point isn’t to predict the future, it’s to make the market easier to understand.
Why It Uses a Log Chart
The platform recently got a major update, so it now displays data using a Log-Linear chart by default.
- time moves normally (from left to right),
- price is shown on a log scale.
This helps remove noise and “crazy” jumps that you often see on normal crypto charts.
Log charts are commonly used for assets that grow fast, like:
- Bitcoin,
- tech stocks,
- and now TAO.
and when an asset grows really fast, a normal chart looks like a straight wall. The Log-Linear view smooths this out, making it easier to see the real trends and long-term patterns.
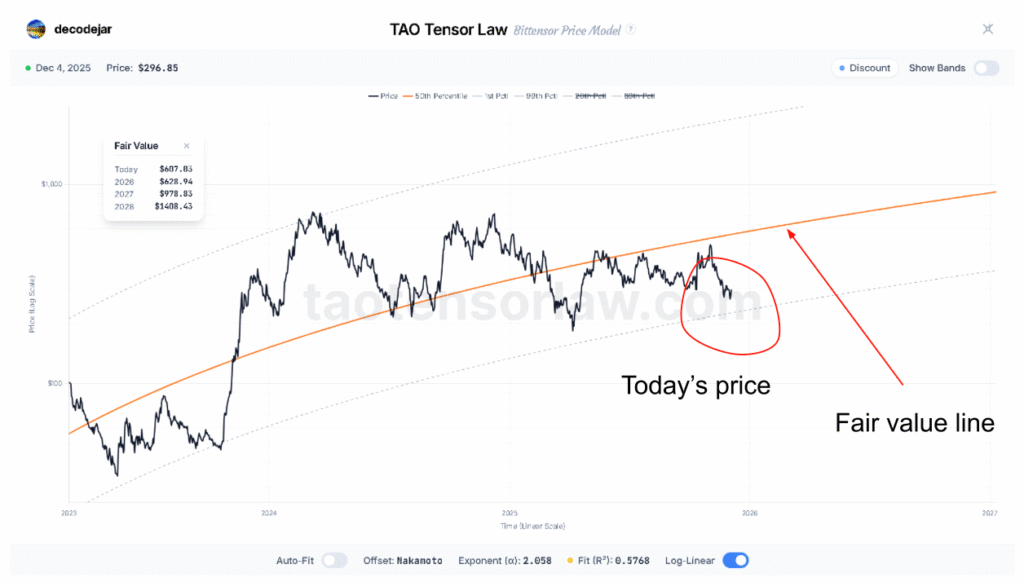
The Power Law Trendline
At the center of TAO Tensor Law is a trendline based on a power law.
Simply put, a power law is a growth pattern where progress is slow in the beginning, then rises faster and faster over time.
This matches how technologies, networks, and communities usually grow.
Because Bittensor expands as more subnets, miners, and models join the network, TAO’s price tends to follow this kind of curve too.
The platform fits TAO’s entire price history onto this curve. That curve becomes the fair value line.
Everything else on the platform is built around this line.
Understanding the Valuation Bands
To make things clearer, the dashboard adds four colored zones around the fair value line.
These represent how far the real price has moved from what the model considers normal.
- Bubble Zone (red): Price is far above trend. This zone often appears during hype cycles.
- Expensive Zone (yellow): Price is above trend but not extreme. Momentum is strong, and interest is rising.
- Value Zone (green): Price is close to the fair value line. Things look healthy, stable, and balanced.
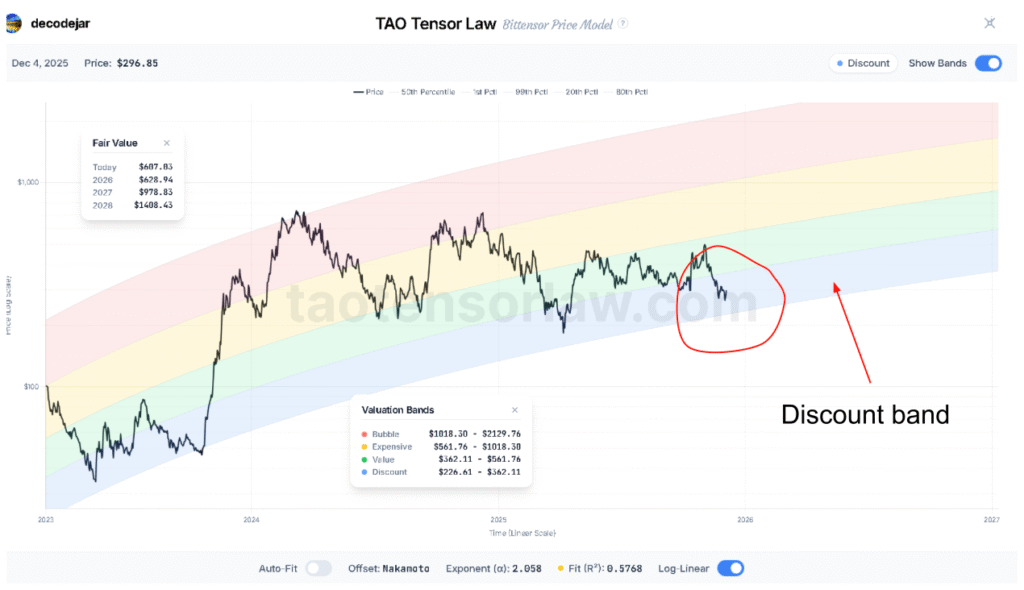
- Discount Zone (blue): Price is below the trend. Market may be scared or ignoring long-term fundamentals.
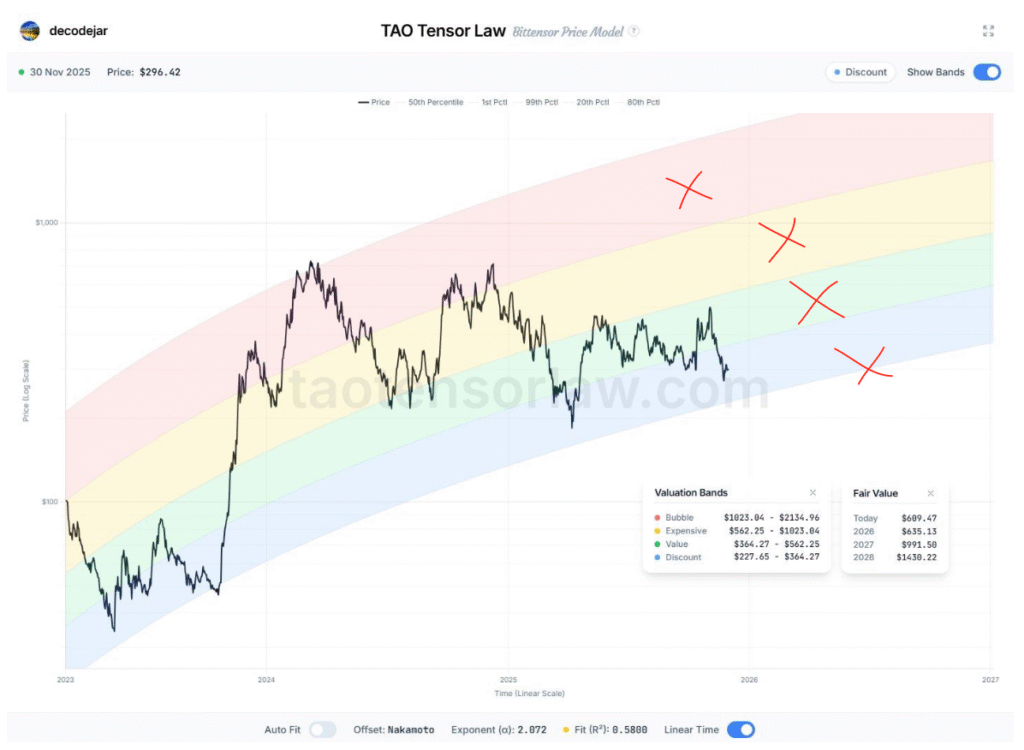
These bands help you answer a simple question: Is TAO overpriced, fairly priced, or undervalued today?
How the Dashboard Works
TAO Tensor Law’s site gives you an interactive chart. You can zoom in and out, switch views, and compare the real price to the fair value line.
The helps you:
- track TAO across months or years,
- see how often TAO enters each zone,
- spot long-term cycles,
- and see whether TAO is following its usual growth path.
It’s designed to be simple on purpose. No complex trading indicators.
Just the price, the trendline, and the bands.
How to Read the Chart as a Beginner
Here’s a quick step-by-step way for newcomers to use the platform:
- Look at the fair value line. This curve shows where TAO “should” be based on long-term behavior.
- Compare today’s price to that line
- Above the line = expensive
- Below the line = discounted
- Close to the line = fair
- Observe the color zone TAO is in. The color tells you whether the market is calm or emotional.
- Zoom out. Look at months or years, not just days. The big picture gives better insight..
- Use it as a guide, not a prediction. It’s a model. It can help your thinking, but it doesn’t guarantee future prices.
Why Tools Like This Matter
Bittensor is not a simple meme coin.
It’s a growing AI economy with dozens of subnets, each offering different forms of computation and intelligence.
As the ecosystem grows:
- TAO becomes more scarce,
- demand increases,
- more subnets compete for rewards,
- and more users enter the network.
From the outside, price moves can look random or crazy. TAO Tensor Law helps cut through that noise.
It shows:
- where the price is now,
- where the long-term trend lies,
- and how far today’s price is from that trend.
It gives the community a more objective way to talk about TAO’s value, instead of relying on hype, fear, or guesses.
What Next?
TAO Tensor Law is a simple visual tool that helps anyone, beginner or expert, understand how TAO behaves over time.
It breaks the market into readable zones, highlights long-term patterns, and provides a calm, honest view of the network’s growth.
If you want a steady, clear perspective on TAO instead of daily confusion, this model is one of the cleanest ways to see what’s really going on with TAO.
Check the live model at TAOTensorLaw.com and follow for Decodejar more updates @decodejar
Read more about the new update here
Enjoyed this article? Join our newsletter
Get the latest Bittensor & TAO ecosystem news straight to your inbox.
We respect your privacy. Unsubscribe anytime.


Be the first to comment